
Where to Put Your Stop Loss: Structure, Volatility and the Mistakes That Get You Stopped Out


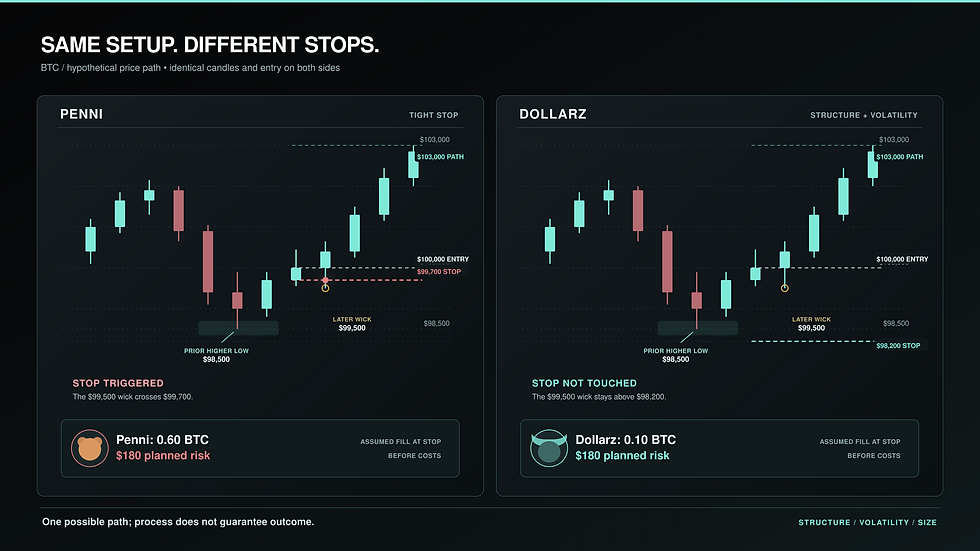
Penni and Dollarz buy the same fictional BTC setup at $100,000. They see a higher low at $98,500 and expect the uptrend to continue. Penni sets her stop at $99,700: a $300 loss per BTC feels manageable. Dollarz first asks what price would actually weaken the setup. He chooses $98,200, below the meaningful low, then reduces his position so the planned dollar risk fits his budget.
BTC falls to $99,500, then rallies. Penni is out; Dollarz is still in. It is tempting to call that proof that Dollarz was right. It isn't. The next dip could have reached $98,200, or the market could have rallied without dipping at all. The useful difference is that Dollarz could explain his stop before seeing the outcome. Penni picked a price because it felt comfortable.
That is the central question in stop-loss placement: what market movement would show that your reason for taking this trade is no longer holding up?

A stop is an exit plan, not a prediction
A stop loss is an order or preplanned exit intended to close a trade if price moves against you. For a long trade, its trigger is usually below the entry; for a short trade, above it. Order behavior depends on the platform and order type. A triggered stop-market order seeks an exit, but its fill price can be worse than the stop price in a fast or thin market. A stop-limit order controls the permitted price but may fail to fill. Check your venue's rules, especially for leveraged crypto positions. The SEC explains the distinction between stop and stop-limit orders.
The stop price should generally follow the trade's invalidation: the point at which the original idea no longer makes sense under the rules of your setup. A swing low, swing high, support or resistance zone, or a break of the structure you traded can provide a reference. None is a universal stop by itself. Your entry method and timeframe determine which level matters.
Read the structure before placing the stop
In a rising market, a simple sequence is higher high → higher low → higher high. The higher low is a pullback that held above the previous meaningful low. If your long trade depends on buyers defending that pullback, a convincing move below it can weaken your thesis.
In a falling market, the mirror image is lower low → lower high → lower low. For a short trade based on that pattern, the recent meaningful lower high can be a reference: a sustained move above it may undermine the bearish idea.
“Meaningful” matters. A tiny one-minute dip inside a four-hour setup may say little about the four-hour trend. Conversely, a five-minute scalp may legitimately depend on a nearby five-minute swing. Support and resistance are often zones where price has reacted, rather than exact lines. A break of structure (BOS) is price moving beyond a prior swing in the direction being studied; what qualifies as a break, including a wick versus a close, needs to be defined in your trading plan.
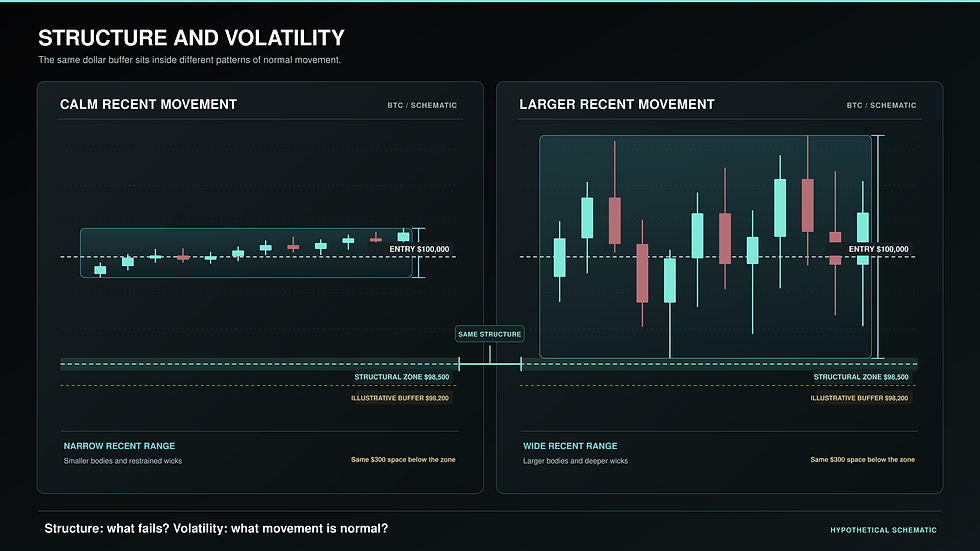
Below the structure does not always mean exactly on the swing low. If a bullish swing low is $98,500, a sell stop at precisely $98,500 can trigger on a brief touch. A trader might consider $98,200 after examining recent swings and volatility. That $300 buffer is an illustration, not a percentage to copy. Some setups are invalid on a touch; others require a close or a larger break. State which one you trade before the price reaches it.

When the stop is too tight
Imagine a BTC long at $100,000. Recent meaningful support sits near $98,500. Trader A selects $99,700 because a $300 move sounds like enough. Price dips to $99,500, triggers the stop, and later reaches $103,000. The original structural support was never tested.
This sequence does not prove the trader was targeted. A $300 pullback can be routine in one environment and substantial in another. What matters is whether the $99,700 stop reflected an actual invalidation rule or merely the loss the trader wanted to see on the screen. If the only affordable position requires that close a stop, reducing the position or skipping the trade may be better than pretending the setup is invalid at $99,700.
When the stop is too wide
Now put the stop for the same $100,000 entry at $90,000. That is $10,000 at risk per BTC under an assumed exact fill. Perhaps the bullish thesis failed well before then. A $103,000 target offers $3,000 upside against $10,000 downside: 0.3:1 reward to risk, before fees and slippage. Holding $100 planned risk would require just 0.01 BTC at that stop distance. Moving the stop farther away without shrinking the position increases the possible loss.
A distant stop does not repair a weak entry. The goal is an appropriate stop: far enough to respect the setup and normal movement, close enough to exit when its premise fails. Sometimes that leaves no acceptable trade.

Structure tells you where; volatility tells you how much room
Volatility is how much price tends to move. In calm conditions, candles and pullbacks may be relatively small. In busy conditions, a market can swing much farther within the same timeframe before continuing. A $100 BTC move can be large for one short-term setup and trivial for another.
Structure tells you where the idea may fail. Volatility helps you judge whether ordinary movement can reach that area or a stop placed nearby. If the market becomes more volatile, you cannot simply widen a stop and keep the same position size without changing risk. You may need a smaller position, a different entry, or no trade.
Average True Range, or ATR, is one way to describe recent volatility. It averages the true range of price bars over a selected lookback; it measures movement in price units, not direction. If BTC's ATR on the timeframe you use is around $1,500, a $200 stop may be very close relative to recent bar ranges. But ATR does not say that price must move $1,500, that every $200 stop is wrong, or that a stop should always sit one ATR from entry. Check the chart's actual swings and whether ATR has been distorted by a recent burst. Fidelity's ATR guide explains what the indicator measures.
The sequence is: structure → invalidation; volatility → room around that idea; risk budget → position size. ATR is context for the second question, not a magic answer to all three.
ATR tells you how much "breathing room" the market may normally need.
Stop distance and position size belong in the same calculation
Set the maximum planned loss you can accept, then size the position from the stop distance. For a simple spot position, ignoring fees and slippage:
Position size = planned dollar risk ÷ absolute distance from entry to stop.
Example | Entry | Stop | Risk per unit | Units for $100 planned risk |
Trade A | $100 | $98 | $2 | 50 |
Trade B | $100 | $95 | $5 | 20 |
Both plan to lose $100 if filled exactly at the stop: 50 × $2 and 20 × $5. A wider stop can carry the same planned dollar risk when the position gets smaller. Neither example establishes which stop makes sense structurally. Also check that the position's purchase cost, margin, fees, contract size and leverage fit your account. Actual loss can exceed the planned figure because a stop price is not a guaranteed fill. CME Group likewise frames sizing around both stop placement and acceptable account risk. See CME's position-size lesson.

Penni and Dollarz: one setup, two plans
Return to the fictional BTC trade. Both buy at $100,000 and both see the $98,500 higher low. Penni places her stop at $99,700 based on a convenient $300 distance. She buys 0.60 BTC without checking her planned loss at the structural stop. Dollarz chooses $98,200 after assessing the higher-low zone, recent swings and volatility, then buys 0.10 BTC for a planned $180 loss under an exact stop fill.
Penni | Dollarz | |
Entry | $100,000 | $100,000 |
Stop | $99,700 | $98,200 |
Reason | Comfortable distance from entry | Setup's structural reference plus illustrative buffer |
Position | 0.60 BTC | 0.10 BTC |
Planned loss at stop, before costs | $180 | $180 |
If price briefly reaches $99,500 | Stop triggers | Position stays open |
Penni's trade can still be rational if she is trading a separate, genuinely short-term setup whose invalidation is $99,700. It is inconsistent with the stated $98,500 higher-low thesis. If the price instead reaches $98,200, Dollarz's planned stop is hit; he does not “win” by having a better process. A well-placed stop can lose, and a poorly placed stop can sometimes avoid a loss. Judge the reasoning over many trades, not from one rebound.
A complete BTC stop-loss walkthrough
Suppose a four-hour BTC chart shows higher highs and a meaningful higher low at $98,500. A trader's plan is to go long at $100,000 if that pattern continues. Recent bars show moderate to high movement; after checking those swings, the trader selects an illustrative stop at $98,200. It is $300 below the swing reference, and $1,800 below entry.
Thesis: The bullish pattern is still intact while the meaningful higher-low area holds under the trader's stated rules.
Invalidation: A move sufficiently below that area would challenge the long. The trader chooses $98,200 as the order trigger after reviewing recent wicks and volatility. It is an example, not a universal buffer or proof of safety.
Risk budget: With $180 of planned risk, $180 ÷ $1,800 per BTC = 0.10 BTC. Buying 0.10 BTC at $100,000 requires about $10,000 of spot capital before fees.
Alternative stop: At $99,700, the distance is $300 per BTC. A 0.60 BTC position would also plan $180 of loss at that trigger, but the stop could activate during a pullback that leaves the $98,500 higher low untouched.
Target check: At a hypothetical $103,000 target, 0.10 BTC offers $300 gross upside against $180 planned downside, or about 1.67:1 reward to risk, before costs. A target is a scenario, not a promise or a reason to stretch the chart.
If the setup needs an even lower stop after honest review, recalculate the size. If the required size, likely costs or reward-to-risk no longer suit the plan, pass on the trade. For derivatives, contract specifications, leverage and liquidation can change the mechanics; never assume the spot arithmetic transfers unchanged.
Match the stop to the timeframe you actually trade
Trade style | Structure to examine | Volatility to examine |
Scalp | Local swing that defines the short-term setup | Recent movement on that short timeframe |
Intraday | Relevant intraday highs, lows and zones | Current session's swings and conditions |
Swing | Higher-timeframe swings and broader invalidation | Larger movement across the holding period |
A five-minute entry with a four-hour stop can be intentional if a four-hour thesis and appropriately sized position support it. A four-hour thesis with a tiny one-minute stop can also be a deliberate, aggressive entry tactic with more frequent stop-outs. Explain the relationship; do not accidentally borrow the entry from one timeframe and the risk logic from another.
Seven stop-loss mistakes that get traders stopped out
Putting the stop exactly on an obvious level. A trader sees support at $98,500 and places the stop at $98,500 without asking whether a brief touch is normal. Treat support as a zone, define invalidation and consider a context-dependent buffer when the setup calls for one.
Using the same fixed percentage everywhere. A 1% stop might fit one calm setup and cut through the middle of another asset's usual swings. Compare the chosen distance with the relevant swing and volatility on the trading timeframe.
Making the stop too tight to afford a large position. A $99,700 stop on the example $100,000 long may preserve position size while abandoning the $98,500 thesis. Find invalidation first, then size; if the result is impractical, skip it.
Making the stop needlessly wide. Placing it at $90,000 just to avoid a normal pullback leaves the trade exposed long after its premise might fail. Describe exactly what would disprove the trade and put the exit plan there, with any justified room.
Ignoring volatility and timeframe. A $200 stop assessed with five-minute candles may behave differently when the trade was built from a four-hour chart or when ranges expand sharply. Review current movement on the timeframe relevant to the setup.
Moving the stop farther away after entry. A trader planned to exit at $98,200 but shifts it to $97,000 because price is falling. That increases risk without restoring the original setup. Any change needs a prewritten rule and a fresh risk calculation; fear of taking a loss is not one.
Entering before deciding the stop and size. A trader buys first, then picks a stop that makes the dollar loss look tolerable. Write down the thesis, invalidation, stop, target and size before submitting the entry. Planned loss should control size, not manufacture a false invalidation level.

“Did the market stop me out on purpose?”
Orders can cluster near conspicuous highs and lows because many people see the same chart. Those clusters can matter for liquidity, the ability to find counterparties and transact around a price. A brief move through a level followed by a reversal can result from ordinary volatility, order flow around that level or a change in short-term demand. A chart alone does not show that someone knew your personal stop or prove a coordinated “stop hunt.”
Review the evidence you actually have: Did the stop sit at an obvious level? Was the move ordinary compared with recent ranges? Did your thesis survive on its own timeframe? Did the stop execute at the price you expected? Calling every losing trade a hunt prevents you from improving the plan. Calling every breakout a trap is no better.

The mistake that turns a planned loss into a large one
Penni buys with a stop below a clearly identified swing. Price falls toward it. “I don't want to get stopped out,” she thinks, and drags the stop lower. Price keeps falling; she moves it again. Her eventual loss is far larger than the amount she agreed to risk when she entered. The trade may still rebound someday, but that possibility did not authorize unlimited downside.
Dollarz's stop gets hit in the same scenario. He records whether the setup, execution and sizing matched his plan, then waits for a new opportunity. He cannot control the next candle. He can control whether he silently rewrites his risk limit as the trade moves against him.
An eight-step stop-loss decision framework
Setup: Write the reason for the trade in one sentence.
Structure: Find the swing, support or resistance zone relevant to that reason.
Invalidation: State what move would contradict the idea, including whether a touch or a close matters to your rules.
Volatility: Compare the prospective stop with recent movement on the relevant timeframe; ATR can help describe it.
Buffer: If justified, leave room beyond the level; do not invent a standard percentage.
Position size: Divide your planned dollar risk by the per-unit stop distance, then account for costs and contract mechanics.
Stop and target: Decide both before the entry; check that the proposed upside and downside suit the strategy.
Trade and review: Place the order according to your venue's rules. If stopped, record what happened without judging the plan solely by whether price later reversed.

Before you enter
Why am I entering?
Where does this particular trade idea become invalid?
Which swing or support/resistance zone matters on my timeframe?
Is the stop inside ordinary recent movement?
What do recent ranges or ATR say about volatility?
Does the setup call for a buffer beyond the level?
What is my planned dollar risk, including likely costs?
What position size fits the stop and available capital?
Where is the target, and does the trade still make sense?
Did I set the stop plan before entering?
The next time a stop is hit just before a rally, look back at the reason for the stop. Was the trade idea invalidated, or did you choose a convenient distance that normal movement could cross? A good answer will not save every trade. It will make your risk deliberate and your review useful.
Educational examples only. Prices, ATR readings and paths above are hypothetical. Trading, especially with leverage, involves losses; stop orders and position sizing cannot guarantee a maximum realized loss.




Comments