
Gold in 2026: Record High, Brutal Sell-Off, and What the October Fed Meeting Could Mean Next

Peni2Dollarz | Market Intelligence | Approximately 8 minutes read
Research cutoff: October 9, 2026, EST, using available reporting through October 8 in the United States.

Gold is supposed to rise during a crisis. So why did it fall?
Penni, our bear, looks at the war headlines and pauses.
“Even I would expect gold to rise when things get this uncertain.”
Dollarz, our bull, opens a second screen: oil, the dollar and bond yields.
“People want protection. But they’re also asking what this means for inflation and interest rates.”
That is the puzzle behind gold’s turbulent 2026. A war can increase demand for safety while also creating conditions that make gold harder to hold.
Gold pays no interest. If investors expect higher returns from dollar assets, some will choose those instead. The same crisis can therefore pull gold in opposite directions.
This is the Peni2Dollarz approach to market intelligence: look beyond the headline and follow the decisions it changes. Before the October Federal Reserve meeting, that means understanding how oil, inflation, rates and the dollar connect.
The Gold 2026 timeline: from record to retreat
Prices below refer to spot gold in US dollars per troy ounce, unless otherwise stated. Intraday quotes are snapshots, not daily closing prices.
When | What happened | Why it matters |
January 29 | Reuters identifies a record of $5,594.82. | The reference point for the subsequent drawdown. |
February 28 | The US-Israeli war with Iran began. | Safety demand competed with energy and inflation concerns. |
April–June | By June 30, Reuters described gold as heading for its worst quarter since Q2 2013. | Expectations of higher rates weighed on demand. |
Late June | Spot gold traded below $4,000. | At $4,000, the decline from the January peak was about 28.5%. |
September 16 | The Fed raised its target range to 3.75–4.00%. | Tighter policy became reality. |
October 7 | Reuters reported spot gold at $4,113.89 in its market update. | Dollar strength and elevated yields remained headwinds. |
Sources: Reuters’ March report, June update, late-June coverage, September Fed statement, and October update.
The important distinction is between a frightening event and its lasting market consequences. Safe-haven demand means buying assets considered protective during uncertainty. It does not mean buyers will keep paying any price indefinitely.

Why gold fell: three forces worth understanding
1. Interest rates raise the cost of holding gold
Imagine choosing between gold and a short-term government security. Gold may appreciate, but it does not send you interest payments. The security offers a yield: income relative to its price.
As available yields rise, holding gold means passing up more income. Economists call that an opportunity cost.
The important measure is often the real yield, meaning the return after allowing for inflation. Rising inflation alone does not tell you whether gold benefits. If yields rise faster than expected inflation, the competition facing gold can become tougher.
Gold can still rise alongside rates when other demand is strong. These are competing pressures, not an automatic pricing formula.
2. A stronger dollar changes the price for everyone else
International gold is commonly quoted in dollars. When the dollar strengthens, the same dollar price costs more in many other currencies. That can discourage some buyers.
For a reader, this also explains why international gold and local gold prices may behave differently. Exchange-rate movements, local premiums and transaction costs affect the rupee price.
A falling dollar gold chart does not automatically translate into an equally large decline at a local jewellery counter.
3. Oil can turn a war into an interest-rate problem
A supply disruption can push oil prices higher. More expensive energy raises transport and production costs and can feed into consumer prices.
If policymakers worry those increases will persist or spread, they may keep rates elevated or raise them. Bond yields and the dollar can respond before the Fed actually acts.
The possible chain looks like this:
War disrupts supply → oil rises → inflation pressure increases → tighter policy becomes more likely → yields or the dollar rise → gold faces pressure.
“So the war helps gold and hurts gold?” Penni asks.
“It creates different pressures,” Dollarz replies. “The question is which one investors are responding to most.”
There is no guaranteed outcome at any link. An energy shock can also weaken spending and growth, giving the Fed reasons to hesitate. Oil can retreat while earlier inflation effects remain.
For a broader explanation of how these connections influence markets, read Peni2Dollarz’s Fundamental Analysis guide.

The Fed’s shift: from holding to hiking
On July 29, the Fed held rates at 3.50–3.75%, but Beth Hammack, Neel Kashkari and Lorie Logan preferred a quarter-point increase. The official statement shows tightening already had support inside the committee.
At Jackson Hole on August 28, Chair Kevin Warsh argued that recent improvements did not establish a sufficiently convincing decline in underlying inflation. His speech set a standard for progress, rather than promising a particular decision.
That stance was hawkish: placing greater weight on controlling inflation and accepting tighter policy to do it.
On September 16, the Fed raised rates by 25 basis points, or 0.25 percentage points, to 3.75–4.00%. It was the first increase in more than three years. September meeting minutes, reported on October 7, indicated most officials anticipated another increase later in 2026, although the rationale and timing remained debated. (AP)
For gold, expectations matter before announcements. A change in the expected path of rates can move prices even on a day when the Fed does nothing.

October 27–28: three scenarios, no guaranteed reaction
The Fed calendar lists the next meeting for October 27–28. The decision comes on the second day.
The useful question is not simply “hike or hold?” It is “how does the decision compare with expectations, and what does it imply next?”
Scenario | What it means | Possible gold response |
Hawkish hike | Another increase, with language favouring further tightening. | Pressure if yields and the dollar rise; $4,000 could attract attention if still nearby. |
Hawkish hold | Unchanged rates, but inflation warnings keep another hike possible. | Two-way volatility as traders reassess the next meeting. |
Dovish hold | Unchanged rates with less urgency to tighten. | A possible relief rally if yields and the dollar ease. |
These are scenarios, not an exhaustive list or price forecasts. A widely expected hike can produce a rally if the guidance is softer than feared. A hold can disappoint buyers who expected stronger reassurance.
What is already priced in?
The CME FedWatch Tool estimates policy probabilities from fed funds futures. These reflect market pricing, not a commitment from the Fed.
A directly readable, timestamped probability table was unavailable during this research, so no percentage is presented as current. Check the October 28 meeting tab before publication and trading; record the date, time and timezone. October and December probabilities are different questions.

The data that can change the interpretation
September CPI:
The Consumer Price Index tracks consumer prices. Its release is scheduled for October 14, after this research cutoff; examine headline and core inflation, which excludes food and energy, against expectations. (BLS calendar)
Jobs:
September payrolls increased 29,000, with unemployment at 4.2%, according to the October 2 employment report. Softer hiring can weaken the argument for urgent tightening, but does not settle the inflation question. (BLS)
PCE inflation:
August headline PCE inflation was 3.4% year over year, with core at 3.0%. September PCE is scheduled for October 29, after the Fed decision, so it belongs on the post-meeting calendar. (BEA)
Oil:
Watch whether Brent or WTI moves persist and why. A temporary supply scare and a sustained energy shock need different interpretations.
DXY:
The US Dollar Index measures the dollar against a basket of major currencies. Watch it alongside Treasury yields; neither is a reliable standalone gold signal.
The bull case and the bear case
Why buyers still have an argument
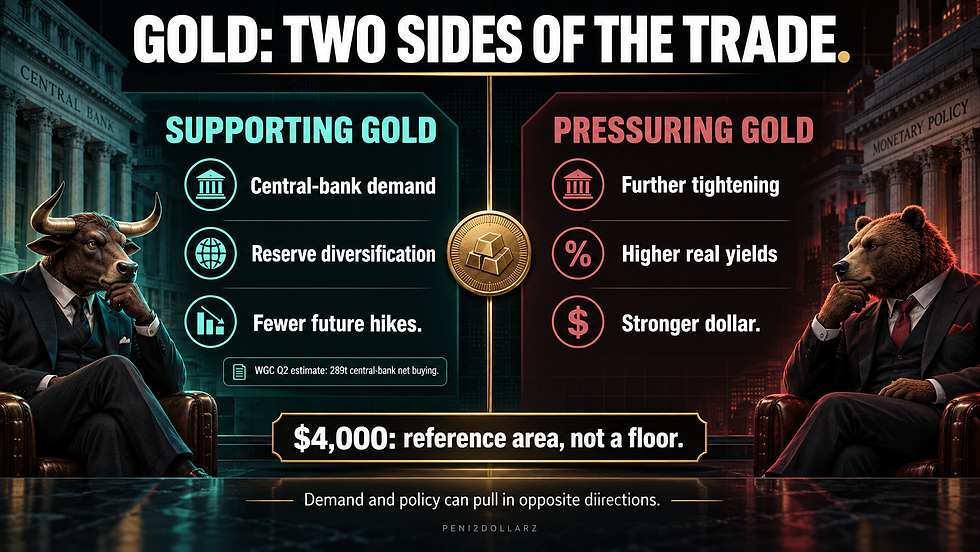
Central banks manage reserves for resilience and diversification, not just next week’s return. Gold can reduce reliance on assets issued by any one government, although it carries price risk and storage costs.
The World Gold Council estimated 289 tonnes of central-bank net purchases in Q2. Its revised Q1 estimate was 57 tonnes, a reminder that demand estimates can change substantially.
Emerging-market reserve diversification can support demand even while higher yields pressure private investors. Future easing, or simply fewer expected hikes, could add support.
Goldman Sachs’ August 28 research projected $4,900 by end-2026. That was a conditional analyst forecast, supported by central-bank buying and an expectation the Fed would remain on hold. September’s hike makes the original policy assumption particularly important. The target is not a promise or a freshly verified October forecast.
Why sellers still have an argument
Persistent inflation could bring further tightening. Higher real yields and a stronger dollar could then outweigh buying by central banks.
The $4,000 area also matters psychologically because round numbers attract attention. But it is not a guaranteed floor. Its technical importance depends on actual trading behaviour: repeated reactions, sustained breaks and whether buyers reclaim it.
Penni sees policy pressure. Dollarz sees structural demand. Both can be right about the forces while disagreeing about which dominates the next move.
A practical approach to Fed day
1. Give the initial reaction room
The first minutes can feature wider spreads, the gap between buying and selling prices, and whipsaws, sharp moves that quickly reverse. Watching instead of entering immediately is a valid choice.
2. Decide your risk beforehand
Smaller positions or staying flat can limit exposure. Stops may fill beyond their intended price during fast markets, so planned risk is not a guaranteed maximum. Review Stop Loss and Win Rate vs Risk-to-Reward before choosing the position size.
3. Treat the press conference as another event
The statement gives the decision; the questions and answers can change its meaning. An initial breakout may reverse when traders hear how strongly the Chair supports further tightening.
4. Wait for a setup you can explain
A 15-minute chart can help organise the noise: identify the announcement range, watch candle closes and assess whether a break holds or fails. One closed candle does not confirm a profitable direction. If the setup remains unclear, skip it.
On October 28, the usual 2:00 PM ET decision time converts to 11:00 PM PKT; the usual 2:30 PM ET press conference converts to 11:30 PM PKT. Eastern daylight time is still in effect. Confirm the final event schedule before trading.

Key takeaways
War can support gold without guaranteeing a rally.
Rates, real yields and dollar strength can overpower safety demand.
Oil affects gold partly through inflation and policy expectations.
October’s reaction depends on the surprise, not just the decision.
A clear setup and controlled exposure matter more than reacting first.
To build a more consistent process, explore the Peni2Dollarz Indicator alongside your own analysis, or 1:1 Coaching / Profit Accelerator for structured learning. Start with understanding the setup and its risk.
Sources / References
Federal Reserve: July 29, 2026 policy statement — holding range and three dissenters.
Federal Reserve: August 28 Jackson Hole remarks — inflation assessment and policy standard.
Federal Reserve: September 16 policy statement — quarter-point hike and target range.
Federal Reserve: FOMC calendar — October 27–28 meeting.
CME FedWatch — methodology and live probability tool; no live percentage reproduced.
BLS: September employment report, released October 2 and October release calendar.
BEA: August personal income and outlays and release schedule — PCE readings and October 29 release.
World Gold Council: Q2 2026 central-bank demand — demand estimates and revisions.
Goldman Sachs: August 28 gold outlook — dated $4,900 forecast and assumptions.
Reuters: March 24 gold report — January record and February war date.
Reuters via Kitco: June 30 gold report — quarterly context and rate/dollar pressures.
Yahoo Finance: June 24 below-$4,000 report — late-June spot-price breach.
Reuters: October 1 gold report and October 7 gold report — dated market snapshots.
AP: October 7 coverage of September Fed minutes — possible further tightening and first hike in three years.
Not financial advice. This article provides education and scenario analysis. by Peni2Dollarz


Comments