
Fundamental Analysis for Beginners: The Economic Data That Moves Financial Markets
- umer qureshi
- 11 hours ago
- 8 min read


Introduction
Fundamental Analysis is the study of real-world economic data and major news events that affect financial markets.
In simple words, it helps traders and investors understand:
“Why is the market moving?”
Many beginners only focus on charts, candles, support, and resistance. That is called technical analysis. But markets also move because of inflation, interest rates, jobs data, central bank decisions, and economic growth reports.
For example, if inflation is high, a central bank may raise interest rates. This can affect forex, stocks, crypto, gold, and oil. That is why professional traders always watch important economic data releases.

How Economic Data Connects Together
Economic data should not be learned randomly. Most important reports are connected.
A simple way to understand it is:
Inflation Data + Employment Data + Growth Data → Central Bank Decisions → Market Reaction
Central banks study inflation, jobs, and economic growth before deciding whether to raise, cut, or hold interest rates.
For beginners, the most important categories are:
Inflation Data
Central Bank and Interest Rate Data
Employment Data
Economic Growth and Consumer Data

How Major News Affects Different Markets
Stock Markets
Stocks usually perform better when the economy is growing and interest rates are low. When inflation is high and interest rates rise, stocks can fall because borrowing becomes expensive and company profits may slow down.
Forex Markets
Currencies are strongly affected by interest rates and central bank decisions. A country’s currency may become stronger if its interest rates rise or its economy looks strong.
Cryptocurrency Markets
Crypto is often treated as a riskier asset. When investors feel confident, crypto can rise. When interest rates are high or fear increases, crypto can fall because investors move toward safer assets.
Commodities
Gold and oil react to inflation, interest rates, demand, supply, and global uncertainty. Gold often rises during fear or inflation concerns. Oil usually rises when demand is strong or supply is limited.

Category 1: Inflation Data
Inflation data shows whether prices are rising or cooling down. This is very important because inflation affects interest rate expectations.
1. CPI: Consumer Price Index
What It Measures
CPI measures how much the prices of everyday goods and services are changing, such as food, rent, fuel, transport, and clothing.
In simple words, CPI tells us whether life is becoming more expensive.
Why Investors Care
Investors care about CPI because it is one of the main ways to measure inflation. If CPI is too high, central banks may raise interest rates to control rising prices.
How Markets Usually React
If CPI is higher than expected, the currency may strengthen, but stocks and crypto may fall because traders expect higher interest rates.
If CPI is lower than expected, stocks and crypto may rise because traders may expect inflation is cooling.
Simple Example
If your grocery bill was $100 last year and the same items now cost $110, prices increased by 10%. That is the basic idea of CPI.
2. Core Inflation
What It Measures
Core inflation measures inflation without food and energy prices because these prices can move up and down quickly.
Why Investors Care
Core inflation helps investors see the deeper inflation trend. If core inflation stays high, it means inflation may be more serious and long-lasting.
How Markets Usually React
Higher core inflation can increase expectations of higher interest rates. Lower core inflation can support stocks and crypto because it shows price pressure may be reducing.
Simple Example
If petrol prices rise because of oil supply issues, headline inflation may rise. But if rent, services, and wages are also rising, core inflation shows stronger inflation pressure.
3. PPI: Producer Price Index
What It Measures
PPI measures price changes for producers and businesses before products reach consumers.
Why Investors Care
PPI can be an early warning sign for inflation. If businesses pay more for materials, they may increase prices for customers later.
How Markets Usually React
Higher PPI can increase inflation fears. Lower PPI can reduce inflation concerns.
Simple Example
If a bakery pays more for flour and electricity, it may increase bread prices. That business cost can later become consumer inflation.
Key Takeaways: Inflation Data
CPI shows consumer price changes.
Core inflation shows the deeper inflation trend.
PPI shows business cost pressure.
High inflation can lead to higher interest rates.
Lower inflation can support stocks, crypto, and risk assets.

Category 2: Central Bank and Interest Rate Data
Central banks are among the biggest market movers. They use interest rates to control inflation and support the economy.
4. Interest Rates
What They Measure
Interest rates are the cost of borrowing money.
When rates are high, loans become expensive. When rates are low, borrowing becomes cheaper.
Why Investors Care
Interest rates affect almost every market. Higher rates can slow the economy, while lower rates can support spending, business growth, and investment.
How Markets Usually React
When interest rates rise, the currency may strengthen, but stocks and crypto may fall.
When interest rates fall, stocks and crypto may rise, but the currency may weaken.
Simple Example
If car loans become expensive, fewer people may buy cars. The same thing happens across the economy when borrowing becomes costly.
5. FOMC Meetings
What They Measure
FOMC meetings are where the U.S. Federal Reserve discusses the economy and decides interest rate policy.
Why Investors Care
The Federal Reserve affects global markets because the U.S. dollar is the world’s most important currency.
Traders watch FOMC meetings to understand whether rates may rise, fall, or stay the same.
How Markets Usually React
If the Fed sounds strict about inflation, the U.S. dollar may rise and stocks, crypto, and gold may fall.
If the Fed sounds softer, stocks and crypto may rise because traders may expect lower rates in the future.
Simple Example
Think of the Fed like a driver. If inflation is too fast, the Fed hits the brakes by raising rates. If the economy is too slow, it may press the accelerator by cutting rates.
6. Central Bank Decisions
What They Measure
Central bank decisions include rate changes and policy updates from banks such as the Federal Reserve, European Central Bank, Bank of England, and Bank of Japan.
Why Investors Care
Central banks control monetary policy, which affects currencies, borrowing costs, business activity, and investor confidence.
How Markets Usually React
A rate hike can strengthen a currency. A rate cut can weaken a currency but support stocks and risk assets.
Simple Example
If one country offers higher interest rates than another, investors may prefer holding that country’s currency.
Key Takeaways: Central Bank and Interest Rate Data
Interest rates are one of the strongest market movers.
Central banks raise rates to fight inflation.
Central banks cut rates to support weak economies.
FOMC meetings are very important for global traders.
Higher rates can support currencies but pressure stocks and crypto.

Category 3: Employment Data
Employment data shows whether people are getting jobs and whether the economy is strong or slowing down.
7. Non-Farm Payrolls
What It Measures
Non-Farm Payrolls, also called NFP, measures how many jobs were added or lost in the U.S. economy, excluding farm jobs.
Why Investors Care
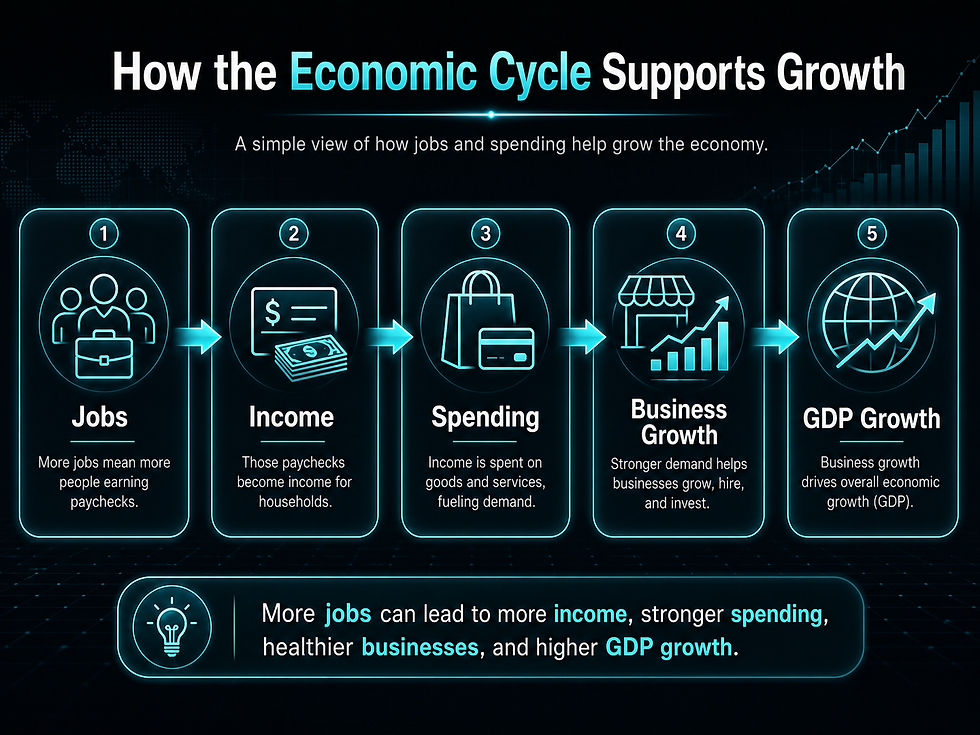
NFP shows whether the economy is strong or weak. More jobs usually mean more income, more spending, and stronger economic activity.
How Markets Usually React
If NFP is higher than expected, the U.S. dollar may strengthen because traders may expect higher interest rates.
If NFP is lower than expected, the dollar may weaken because it may signal slower growth.
Simple Example
If companies are hiring more workers, people earn more salaries and spend more money. This supports the economy.
8. Unemployment Rate
What It Measures
The unemployment rate shows the percentage of people who are looking for work but cannot find a job.
Why Investors Care
Low unemployment usually shows a strong economy. High unemployment can show economic weakness.
How Markets Usually React
Lower unemployment can support a currency. Higher unemployment can weaken a currency and hurt investor confidence.
Simple Example
If many people lose jobs, they spend less money. When spending falls, businesses earn less and the economy can slow down.
Key Takeaways: Employment Data
NFP shows how many jobs were added or lost.
The unemployment rate shows labor market weakness or strength.
Strong jobs data can support a currency.
Weak jobs data can signal economic slowdown.
Jobs data affects interest rate expectations.

Category 4: Economic Growth and Consumer Data
Growth and consumer data show whether the economy is expanding or slowing.
9. GDP: Gross Domestic Product
What It Measures
GDP measures the total value of goods and services produced by a country.
In simple words, GDP shows whether an economy is growing or shrinking.
Why Investors Care
Strong GDP growth shows a healthy economy. Weak GDP growth can signal slowdown or recession risk.
How Markets Usually React
Higher GDP can support stocks and the currency. Lower GDP can weaken the currency and pressure stocks.
Simple Example
Think of a country like a business. If it produces more and earns more, it is growing. GDP measures that growth.
10. Retail Sales
What It Measures
Retail Sales measures how much consumers are spending in stores and online.
Why Investors Care
Consumer spending is a major part of the economy. If people spend more, businesses earn more. If people spend less, the economy may slow down.
How Markets Usually React
Higher Retail Sales can support the currency and stocks. Lower Retail Sales can create concerns about weak demand.
Simple Example
If malls, restaurants, and online stores are busy, it usually means consumers are confident and spending money.
11. Consumer Confidence
What It Measures
Consumer Confidence measures how optimistic or worried people feel about the economy.
Why Investors Care
If people feel confident, they are more likely to spend. If they feel worried, they may save more and spend less.
How Markets Usually React
Higher confidence can support stocks and currencies. Lower confidence can pressure markets because it may signal weaker future spending.
Simple Example
If people feel secure in their jobs, they may buy cars, travel, or shop more. If they are worried, they reduce spending.
12. PMI: Purchasing Managers’ Index
What It Measures
PMI measures business activity in manufacturing and services.
A PMI above 50 usually means business activity is expanding. A PMI below 50 usually means it is shrinking.
Why Investors Care
PMI gives an early signal of economic strength or weakness.
How Markets Usually React
Higher PMI can support stocks and currencies. Lower PMI can pressure markets because it may signal slower growth.
Simple Example
If factories are receiving more orders, PMI may rise. If orders slow down, PMI may fall.
Key Takeaways: Growth and Consumer Data
GDP shows overall economic growth.
Retail Sales shows consumer spending.
Consumer Confidence shows how people feel about the economy.
PMI gives an early signal of business strength or weakness.
Strong growth data can support markets.
Weak growth data can signal slowdown.
Which Economic Events Should Beginners Watch First?
Beginners do not need to follow every report. Start with the most important ones.
Priority List
Interest Rate Decisions
FOMC Meetings
CPI and Core Inflation
Non-Farm Payrolls
GDP
Retail Sales
PMI
PPI
These events usually create the strongest market reactions, especially in forex, gold, indices, and crypto.
Simple Beginner Framework
When news is released, ask these three questions:
1. Was the number higher or lower than expected?
Markets usually react to the difference between the actual number and the forecast.
2. Does this increase or reduce inflation pressure?
Higher inflation pressure may increase the chance of higher interest rates.
3. What will the central bank likely do next?
This is often the most important question because markets move based on future expectations.
For example, strong jobs data may look positive. But if it increases inflation pressure, markets may fear higher interest rates, which can hurt stocks and crypto.
A common beginner mistake is thinking:
“Good news means the market must go up.”
That is not always true.
Sometimes good news can make markets fall if traders expect higher interest rates. Sometimes weak news can make markets rise if traders expect rate cuts.
Conclusion
Fundamental analysis helps traders understand the real reasons behind market movement.
The easiest way for beginners to study economic data is by grouping it into four categories:
Inflation Data
Central Bank and Interest Rate Data
Employment Data
Economic Growth and Consumer Data
Inflation data shows price pressure. Employment data shows labor market strength. Growth data shows whether the economy is expanding or slowing. Central banks use all this information to decide interest rates.
These decisions then affect forex, stocks, crypto, gold, oil, and other financial markets.
Charts show what price is doing. Fundamentals help explain why price may be moving.
By understanding economic data, beginners can read the market more clearly, avoid emotional decisions, and make more informed trading choices.

Comments