
Supply and Demand Zones Explained Simply by Peni2DollarzFx
- umer qureshi
- 1 day ago
- 18 min read


Price does not rise simply because a chart looks bullish, and it does not fall because a line was drawn across a previous high. Price moves when the buying and selling pressure reaching the market becomes sufficiently unbalanced.
In simple terms, demand describes buying interest, while supply describes selling interest. When aggressive buying outweighs available selling, price must trade higher to find more sellers. When aggressive selling outweighs available buying, price must trade lower to find more buyers.
Supply and Demand analysis tries to locate the chart areas where that imbalance previously became strong enough to produce a meaningful move. Traders then study what happens if price returns to one of those areas.
That does not mean every marked zone contains unfilled institutional orders, or that price must reverse there. A chart shows executed price behaviour—not a complete record of every participant's intention. A Supply or Demand Zone is therefore best treated as an area of interest supported by evidence, not a guaranteed turning point.
Central principle: Markets move through the interaction of buying and selling pressure. Supply and Demand analysis attempts to identify areas where that imbalance was significant enough to move price.
1. Start With the Core Idea
Every completed trade has both a buyer and a seller. Price direction is not determined by the number of buyers versus sellers; each transaction requires both. What matters is urgency and available liquidity.
Buyers who are willing to pay progressively higher prices can lift the market.
Sellers who are willing to accept progressively lower prices can push it down.
If available orders at the current price cannot absorb that pressure, price moves to the next prices where more liquidity is available.
Supply
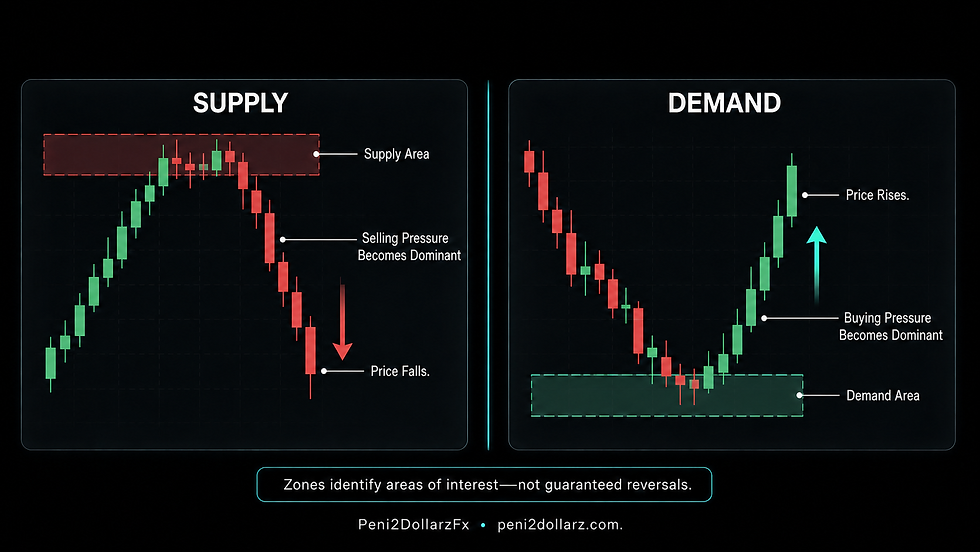
Supply refers to willingness to sell. On a chart, traders look for areas from which selling pressure was associated with a sharp decline. Such an area may later be marked as a potential Supply Zone.
Demand
Demand refers to willingness to buy. Traders look for areas from which buying pressure was associated with a sharp advance. Such an area may later be marked as a potential Demand Zone.
The important word is associated. A fast move away from an area is visible; the exact reason behind every order is not. News, hedging, liquidations, algorithmic execution, profit-taking, thin liquidity, and many other forces can contribute to the move.
This is why a valid analysis needs more than “price rose here.” Traders also examine the base, strength of departure, market structure, freshness, liquidity, and space available before an opposing area.
2. What Exactly Is a Supply or Demand Zone?
A Supply Zone is a price area from which selling pressure previously became strong enough to drive price meaningfully lower.
A Demand Zone is a price area from which buying pressure previously became strong enough to drive price meaningfully higher.
Why a zone has width
Markets rarely turn at one perfectly exact price. Orders can be distributed across several prices, spreads vary, candles aggregate many transactions, and different traders use different timeframes. A rectangular area is therefore usually more realistic than a one-pixel line.
The two edges are commonly described as:
Proximal boundary: the edge closest to current price as price returns.
Distal boundary: the far edge of the zone, often used when defining invalidation.
For a Demand Zone below price, the proximal boundary is normally its upper edge and the distal boundary its lower edge. For a Supply Zone above price, the proximal boundary is normally its lower edge and the distal boundary its upper edge.
Traders differ on whether to include candle wicks, bodies, or an entire base. There is no universally correct drawing rule for every market. The important practice is to define one objective method and use it consistently when backtesting.
What can happen on a return?
Price may:
React from the proximal edge.
Trade deeper into the zone before reacting.
pause inside it without producing a tradeable reversal.
move completely through it and invalidate the original idea.
A zone identifies where additional evidence may matter. It is not, by itself, an instruction to buy or sell.

3. The Logic Behind How Supply and Demand Zones Form
The basic sequence is:
Price enters a base → imbalance produces a strong departure → price moves away → the area remains relevant → price may later return
Step 1: The base
A base is a compact pause or short consolidation in which candles overlap and price travels relatively little. It may contain small-bodied candles, mixed bullish and bearish closes, or short wicks on both sides.
A base matters because it gives the move a definable origin. However, every sideways pause is not automatically a useful zone. Without a meaningful departure and supporting context, it may be ordinary noise.
Step 2: The strong departure
Price then leaves the base with urgency. Evidence of a strong departure may include:
large candle bodies relative to recent candles;
consecutive candles moving in the same direction;
limited overlap between departure candles;
a break of a meaningful swing high or low;
a visible price imbalance or Fair Value Gap;
little immediate rejection back into the base.
The departure is crucial. It demonstrates that the area coincided with enough pressure—or insufficient opposing liquidity—to move price decisively.
Step 3: Price moves away
The greater the clean distance price creates before returning, the easier it is to distinguish the zone from nearby noise. A move that immediately stalls at an opposing zone offers less space and may produce poor reward relative to risk.
Step 4: The zone remains relevant
After the departure, traders extend the base forward as a potential area of interest. They are recording where the move began, not proving that hidden orders remain there.
Step 5: Price returns
Price may revisit the area during a pullback, rebalance, liquidity search, change in sentiment, or ordinary two-way auction. If the market reacts, the chart confirms that the area remains relevant at that moment. If price accepts beyond it, the original thesis may be invalid.
Observation versus interpretation
This distinction protects traders from turning a useful chart framework into an unsupported story.
Observable on the chart | Possible trader interpretation |
Small, overlapping candles form a base | Buying and selling were temporarily balanced |
Large candles depart with little overlap | A meaningful imbalance developed |
A prior swing is broken | The move changed or continued visible structure |
Price later reacts in the area | Interest was present again on the return |
Price closes through the distal boundary | The original zone thesis no longer holds under the chosen rule |
The chart does not reveal the identity of participants or prove that a specific institution left unfilled orders behind.

4. Main Types of Supply and Demand Zones
The four most useful patterns are named according to what price does before the base and after it.
Rally-Base-Rally (RBR): Demand continuation
Before the base: Price rallies upward.
At the base: Price pauses in a compact consolidation.
After the base: Price rallies again with a strong bullish departure.
Meaning: Demand appears during an existing upward move, so this is normally classified as a continuation pattern.
Look for: A clean base, decisive bullish departure, and enough room before major Supply.
Sequence: up → pause → up
Drop-Base-Rally (DBR): Demand reversal
Before the base: Price drops into the area.
At the base: Selling slows and price consolidates.
After the base: Price rallies strongly.
Meaning: The direction changes from down to up, so this is normally classified as a reversal pattern.
Look for: A bullish displacement that removes a prior high or changes bearish structure, ideally after sell-side liquidity is swept.
Sequence: down → pause → up
Drop-Base-Drop (DBD): Supply continuation
Before the base: Price falls.
At the base: Price pauses in a compact consolidation.
After the base: Price continues lower with a strong bearish departure.
Meaning: Supply appears during an existing downward move, making this a continuation pattern.
Look for: A decisive break lower, limited candle overlap, and room before significant Demand.
Sequence: down → pause → down
Rally-Base-Drop (RBD): Supply reversal
Before the base: Price rallies into the area.
At the base: Buying slows and price consolidates.
After the base: Price drops strongly.
Meaning: The direction changes from up to down, making this a reversal pattern.
Look for: Bearish displacement that removes a prior low or changes bullish structure, potentially after buy-side liquidity is swept.
Sequence: up → pause → down
Pattern | Direction before base | Direction after base | Zone | Typical role |
RBR | Rally | Rally | Demand | Continuation |
DBR | Drop | Rally | Demand | Reversal |
DBD | Drop | Drop | Supply | Continuation |
RBD | Rally | Drop | Supply | Reversal |
The label describes the path, not the quality. An RBR is not automatically stronger than a DBR, and a reversal formation is not automatically more profitable than a continuation formation.

5. How to Identify a High-Quality Zone
Good analysis is selective. If rectangles cover most of the chart, the method is no longer helping the trader distinguish meaningful locations.
A practical quality framework
Base + Strong Departure + Context + Freshness + Space = Higher-Quality Candidate
This is an educational framework, not a formula that guarantees a successful trade.
1. A clean base
Look for a compact cluster rather than a long, messy range. Fewer candles and controlled overlap often make the origin easier to define. A long base may contain several competing zones and unclear boundaries.
2. Strong departure and displacement
A high-quality candidate should move away decisively. Large bodies, consecutive directional candles, minimal overlap, an imbalance, or a structural break strengthen the evidence. Weak, hesitant movement suggests the base did not produce a meaningful shift.
3. Freshness and limited tests
A fresh zone has not been revisited since its creation. Each return can consume available liquidity or reveal that the area is no longer producing the same response. This is a useful tendency, not an unbreakable law: some zones survive several tests, while others fail on the first.
4. Market-structure location
A Demand Zone supporting a higher low in a bullish trend has different context from a Demand Zone positioned directly beneath repeated lower highs in a strong bearish trend. Similarly, Supply aligned with bearish structure may be more coherent than Supply selected in the middle of a powerful uptrend.
5. Higher-timeframe alignment
A lower-timeframe zone located inside a clear daily or four-hour area can offer more meaningful context. But higher timeframe does not mean invincible; it usually means the area represents a broader range of transactions and requires a wider invalidation distance.
6. Clear imbalance
A clean departure that leaves little two-way overlap suggests urgency. Some traders also use a Fair Value Gap as supporting evidence. The imbalance should support the departure, not replace analysis of the zone itself.
7. Meaningful consequence
Ask what the departure accomplished. Did it break a swing? Cause a BOS? Produce a CHoCH? Sweep liquidity and reverse? Travel far enough to matter? A zone whose departure produces no structural consequence is less compelling.
8. Room to move
A Demand entry directly beneath major Supply may offer little upside. A Supply entry directly above major Demand may offer little downside. The distance to an opposing zone, liquidity pool, or structural target should justify the risk.
9. Defined risk and realistic reward
Even an obvious zone may require such a wide stop that the trade is unattractive. A well-supported trading zone must also allow objective invalidation, sensible position sizing, and a target that produces acceptable risk-to-reward under the trader's plan.
The difference is simple: a visually obvious zone looks clean on a historical chart; a well-supported trading zone also fits structure, timing, invalidation, liquidity, and risk.

6. Fresh, Tested, and Invalidated Zones
Zone status changes as new candles form.
Fresh Zone
A zone is fresh when price has not returned since the original departure. Many traders prioritize the first revisit because it provides the first real-time test of whether the area still matters.
Freshness alone is not proof of quality. A fresh zone with a weak departure and poor context can still fail.
Tested or mitigated zone
A tested zone has already been revisited. Traders often use mitigated to describe the idea that some prior interest has been filled, reduced, or otherwise addressed. That explanation is an interpretation; the observable fact is simply that price returned and traded within the area.
A touch does not automatically invalidate a zone. Price can enter it, react from its midpoint or distal edge, and still respect the selected invalidation rule.
Repeated deep tests generally deserve caution. If each reaction becomes smaller, price spends longer inside the zone, or candles repeatedly close deeper into it, the evidence of defence is weakening.
Invalidated Zone
A zone is invalid when price violates the objective rule defined before entry. Common rules include:
a candle close beyond the distal boundary;
full-bodied acceptance beyond the zone;
a structural break that contradicts the reason for the trade.
A wick beyond the boundary may count as invalidation for one tested strategy and as a liquidity sweep for another. Neither interpretation should be chosen after seeing the outcome. Define the rule first, test it consistently, and apply it without moving the boundary to rescue a losing idea.

7. Supply and Demand With Market Structure and Liquidity
A rectangle has limited value without context. Market structure explains the prevailing path, while liquidity and displacement help explain what price did before leaving or returning to a zone.
Market structure
A bullish structure generally forms higher highs (HHs) and higher lows (HLs). A bearish structure generally forms lower lows (LLs) and lower highs (LHs).
A Break of Structure (BOS) usually describes a break in the direction of the prevailing trend.
A Change of Character (CHoCH) usually describes the first meaningful break against the prevailing trend and warns that behaviour may be changing.
Terminology varies among educators, so the trader should define which swing qualifies and whether a wick or close confirms the break.
Liquidity
Obvious highs, lows, equal highs, equal lows, session extremes, and range boundaries may attract clustered orders. When price briefly trades beyond one of these areas and then rejects, traders often call it a liquidity sweep.
A sweep does not guarantee reversal. It becomes more useful when followed by decisive displacement, a structural shift, and a clearly defined zone.
Combining the evidence
Consider a bullish example:
The higher timeframe is making HHs and HLs.
Price pulls back toward an established Demand area.
Equal lows form just above or within the area.
Price trades below those lows, then recovers.
Bullish displacement breaks a lower-timeframe swing high.
The base or origin of that displacement defines a refined Demand Zone.
A return to that zone provides an area to watch for confirmation.
Now compare a Demand Zone during a strong bearish market. If price continues printing LLs and LHs, the zone sits against prevailing order flow. It may still cause a bounce, but the context is different and the expectation may need to be smaller or require stronger confirmation.
Location and context matter more than simply finding a rectangle. The strongest-looking zone can fail when it conflicts with structure, sits in the middle of a range, or has no room before opposition.

8. How Traders Use Supply and Demand Zones
Traders generally use zones to organize entry, invalidation, and target decisions. The approach can be aggressive or conservative.
Entry methods
Blind zone entry
A pending order is placed in a preselected part of the zone without waiting for new confirmation.
Advantage: Earlier entry and potentially better reward-to-risk.
Disadvantage: No evidence that the area is being respected on this return.
Best suited to: A thoroughly tested plan with strict selection and risk limits.
Confirmation entry
The trader waits for evidence inside or around the zone, such as rejection, displacement, a meaningful engulfing close, or a lower-timeframe structural shift.
Advantage: More evidence that price is responding.
Disadvantage: Later entry, wider effective risk, or a missed move.
Lower-timeframe confirmation
A higher-timeframe zone provides location, while a lower timeframe provides timing. For example, a trader may mark four-hour Demand and wait for a five-minute sweep plus bullish CHoCH before considering entry.
Lower timeframes also contain more noise. Confirmation rules must identify meaningful swings rather than treating every tiny candle break as a signal.
Stop-loss placement
Common approaches include:
Beyond the zone: The stop sits beyond the distal boundary with a tested buffer.
Beyond structural invalidation: The stop sits beyond the swing whose failure disproves the setup.
Placing a stop exactly where it creates a preferred position size is backward. First define where the trade idea is wrong; then calculate the position size from that distance.
Potential targets
Logical objectives may include:
the nearest opposing Supply or Demand Zone;
previous swing highs or lows;
equal highs, equal lows, or other liquidity;
range boundaries;
structural objectives, such as a prior HH in a bullish continuation.
Risk, reward, and position size
If the entry-to-stop distance is 20 points and the entry-to-target distance is 40 points, the planned reward-to-risk ratio is 2:1 before fees, slippage, and execution differences. That ratio says nothing about probability. A high reward-to-risk setup can still have a low win rate.
Position size should be derived from a predetermined amount of account risk:
Position size = Amount at risk ÷ Loss per unit at the stop
The exact calculation depends on the instrument's contract size, tick value, currency conversion, and trading costs.
A zone is an area of interest, not an automatic buy or sell signal.
9. Supply and Demand vs Support and Resistance vs Order Blocks
These concepts overlap, but they begin from different analytical questions.
Concept | Main focus | Typical marking method | Key evidence | Common misuse |
Supply and Demand | Areas from which a strong buying or selling imbalance was associated with a meaningful departure | A base or origin area drawn as a rectangle | Base, displacement, structure, freshness, space | Marking every pause as a zone or claiming hidden orders are proven |
Support and Resistance | Prices or areas repeatedly respected as floors, ceilings, or decision points | Horizontal level or band across reactions | Multiple historical reactions, swing points, range boundaries | Treating a line as an exact barrier that cannot break |
Order Blocks | An SMC-defined candle or candle cluster preceding a significant move | Usually the final opposing candle or defined cluster before displacement | Displacement, structural consequence, liquidity context | Calling every opposite-coloured candle an Order Block |
Supply and Demand
Supply and Demand analysis emphasizes the origin area and departure. The base often includes more than one candle and is evaluated through imbalance, freshness, and context.
Support and Resistance
Support and Resistance usually emphasizes historical reaction levels. A level may become important because price has repeatedly turned, paused, or broken and retested there—even if it did not begin with a textbook base-and-departure pattern.
Order Blocks
Order Blocks are usually defined more narrowly within Smart Money Concepts. Many traders mark the final bearish candle before a significant bullish move as a bullish Order Block, or the final bullish candle before a significant bearish move as a bearish Order Block. A sound definition also requires displacement and structural consequence; candle colour alone is not enough. Read more
A single chart area may qualify under more than one framework. For example, a bearish candle at the edge of a DBR base could be described as a bullish Order Block inside a broader Demand Zone, while the same area may align with prior Support. The labels are tools for organizing evidence, not competing laws of the market.

10. Why Zones Fail and the Most Common Mistakes
No zone is guaranteed to hold. Markets absorb new information, liquidity changes, trends accelerate, and participants who mattered during the original move may no longer behave the same way.
Why a correctly identified zone can fail
New information or major volatility: Economic releases, central-bank decisions, earnings, geopolitical events, or unexpected headlines can overwhelm prior technical areas.
A powerful opposing trend: Momentum may be strong enough to trade through a countertrend zone.
Repeated tests: Each revisit may reduce the strength of the response.
Range behaviour: Zones inside the middle of a range are often surrounded by two-way noise.
Nearby opposition: The area may produce a reaction but lack enough space for continuation.
Liquidity conditions: Thin markets, session changes, gaps, and slippage can alter execution and reaction quality.
Common identification and execution mistakes
Treating every base as a zone. A useful candidate needs a consequential departure.
Drawing the zone after the reaction. Hindsight makes boundaries appear obvious; real-time rules must identify them before the outcome.
Ignoring higher-timeframe structure. A clean lower-timeframe zone may be positioned directly against dominant movement.
Using an excessively wide rectangle. Broad zones can hide poor precision and create unworkable risk.
Over-refining the zone. Selecting a tiny candle only because price later respected it introduces hindsight bias.
Entering without a defined trigger. Traders may alternate between blind and confirmation entries depending on fear or excitement.
Moving the stop. Expanding invalidation after entry changes the trade rather than managing it.
Assuming a wick means failure—or always means a sweep. The answer depends on the tested rule.
Expecting every reaction to become a reversal. A zone can produce a short bounce before the larger trend continues.
Risking more because a setup “looks perfect.” Visual confidence does not remove uncertainty.
Zone failure versus incorrect identification
A zone failure occurs when a candidate met the trader's pre-defined criteria but price later invalidated it. This is a normal trading outcome.
An incorrectly identified zone never met those criteria—for example, it lacked a clean base, strong departure, or relevant structure. Calling every loss a failed zone prevents the trader from discovering whether the real issue was selection, execution, or ordinary probability.
The solution is a journal that records the zone before entry, including timeframe, boundaries, pattern, freshness, departure quality, context, trigger, invalidation, and outcome.
11. Practical Chart Walkthrough and Advanced Understanding
The following example is hypothetical and uses no future candles at each decision point.
Bullish walkthrough
1. Higher-timeframe context
On the four-hour chart, price has formed a higher high at 1.1200 and a higher low at 1.1100. The bullish structure remains intact while price trades above 1.1100.
2. Liquidity develops
On the one-hour chart, two similar lows form around 1.1120. These equal lows create a visible area of sell-side liquidity.
3. Price reaches the area
Price trades below 1.1120 and enters the broader four-hour discount area. It approaches a prior base between 1.1105 and 1.1125.
4. The base and departure become visible
Several compact candles form between 1.1110 and 1.1120. Price then rallies with two large bullish candles, leaves limited overlap, and closes above the latest one-hour lower high at 1.1160.
The observable evidence is a sweep, compact base, bullish displacement, and structural break. A trader may interpret this as renewed buying interest, but the candles do not identify who bought.
5. The Demand Zone is defined
Using a pre-tested whole-base rule, the trader marks Demand from 1.1110 to 1.1120. The upper edge at 1.1120 is proximal; the lower edge at 1.1110 is distal.
6. Price returns
Price advances to 1.1190, then pulls back for the first time. Because the zone is fresh, the trader watches rather than assuming it will hold.
7. Confirmation appears
Inside the zone, the five-minute chart briefly breaks a local low, recovers, then closes above the most recent lower high with bullish displacement. This satisfies the trader's confirmation rule.
8. Entry and invalidation
A hypothetical entry is taken at 1.1124 after confirmation. The structural stop is placed at 1.1107, beneath both the distal boundary and the sweep low, giving 17 pips of planned risk.
9. Target
The prior four-hour high and nearby buy-side liquidity sit around 1.1200. That creates a hypothetical 76-pip distance from entry, or roughly 4.47R before costs. A trader might reduce the target or take partial profit at intermediate Supply, depending on the tested plan.
10. Two valid outcomes
If price reaches the target, the zone and confirmation supported a successful setup.
If price closes below the invalidation level, the planned loss is accepted. The failure does not prove the entire concept useless, just as one winner does not validate it.

Brief bearish version
In bearish structure, price rallies above equal highs into Supply, forms a compact base, departs downward with displacement, and breaks a meaningful swing low. On a return, a trader may wait for a lower-timeframe bearish shift, place invalidation above the zone or structural high, and target prior lows, sell-side liquidity, or opposing Demand.
Advanced insights
Multi-timeframe zones: A weekly or daily zone provides broad location; a four-hour or intraday zone can refine execution. The timeframes should have defined roles.
Refining a zone: Bodies, wicks, or the final opposing candle may reduce stop distance, but refinement also increases the chance that price turns before reaching the narrow area.
Nested zones: A smaller Demand Zone can exist inside a larger Demand Zone. The nested area may improve precision but does not override failure of the broader structural thesis.
Premium and discount: Within a defined dealing range, traders may prefer Demand below the 50% equilibrium and Supply above it. This is supporting context, not a standalone signal.
Trends versus ranges: Trend-aligned zones may support continuation. At range extremes, reversal zones may matter; zones in the range midpoint are often less clear.
Hindsight bias: Historical charts reveal the reaction, making the “correct” base easy to select. Real-time screenshots and bar-replay testing expose the true difficulty.
Consistency and backtesting: The trader should standardize base definition, boundary selection, break confirmation, entry trigger, invalidation, target, and risk. Results can then be evaluated across a meaningful sample rather than remembered selectively.
12. Final Checklist, FAQ, and Learning Path
Supply and Demand Zone checklist
Before considering a zone, ask:
Is the market context clear?
Is there a meaningful, compact base?
Was the departure strong and consequential?
Is the zone fresh or already tested?
Is there clear displacement?
Does the zone align with market structure?
Is relevant liquidity nearby?
Is there enough room toward the target?
Where is objective invalidation?
Is the potential reward reasonable for the risk?
If several answers are unclear, the best decision may be to wait. Missing a trade costs nothing; forcing a weak setup can cost capital and discipline.
Frequently asked questions
Are Supply and Demand Zones guaranteed to reverse price?
No. They identify areas where a meaningful move previously began. Price may react, pause, or trade straight through them.
Is a fresh zone always the strongest zone?
No. Freshness is one useful characteristic. Departure strength, structure, location, liquidity, and space still matter.
Should zone boundaries include candle wicks?
Different tested methods use full ranges, bodies, or selected candles. Choose an objective rule, record it, and compare its results. Do not switch methods after seeing the reaction.
How many candles can form a base?
There is no universal number. Compact bases with limited candles are often easier to define, while long ranges can contain several smaller areas. Your rule should specify what qualifies.
Does one touch invalidate a zone?
No. A touch normally changes the zone from fresh to tested. Invalidation occurs only when price violates the pre-defined boundary or structural rule.
Can Supply become Demand, or Demand become Supply?
Yes. After a decisive break and acceptance, a former Supply area may act as Demand on a retest, and former Demand may act as Supply. This is sometimes called a role reversal or flip zone, but it still requires evidence.
Which timeframe is best?
No timeframe is universally best. Higher timeframes provide broader context and wider zones; lower timeframes provide detail but more noise. Many traders use a higher timeframe for direction and a lower timeframe for execution.
Are Supply and Demand Zones the same as Order Blocks?
Not exactly. They can overlap, but a Supply or Demand Zone often covers a base, whereas an Order Block is commonly a specific candle or tight cluster defined within an SMC framework.
Should I enter as soon as price reaches a zone?
Only if a tested trading plan explicitly uses blind entries. Beginners often benefit from learning confirmation and invalidation before risking money.
Continue the Peni2DollarzFx learning path
Supply and Demand becomes more useful when it is studied as part of a complete price-action framework:
Market Structure → Liquidity → Supply and Demand → Fair Value Gaps → Imbalances → Order Blocks → Trade Execution → Risk Management
Continue through the related Peni2DollarzFx educational articles on peni2dollarz.com, practise each concept independently, and combine them only when you can define the rules clearly.
Educational disclaimer: This material is for education only and is not financial advice or a promise of results. Trading involves substantial risk. Historical chart behaviour does not guarantee future performance.


Comments